The Wall Street Journal had lost traffic to its online market data content due to two trends. First, as The Journal had expanded its focus on general news and business, the financial industry readers who used its market data most heavily had become a smaller share of its overall audience. Second, although its readers increasingly used mobile devices, none of The Journal’s pages were mobile-friendly.
We began by leading focus groups of site users. To identify usage patterns, we printed wall-length posters of our and competitor market data sites and asked users to stick Post-it notes on features they liked, disliked, or needed.
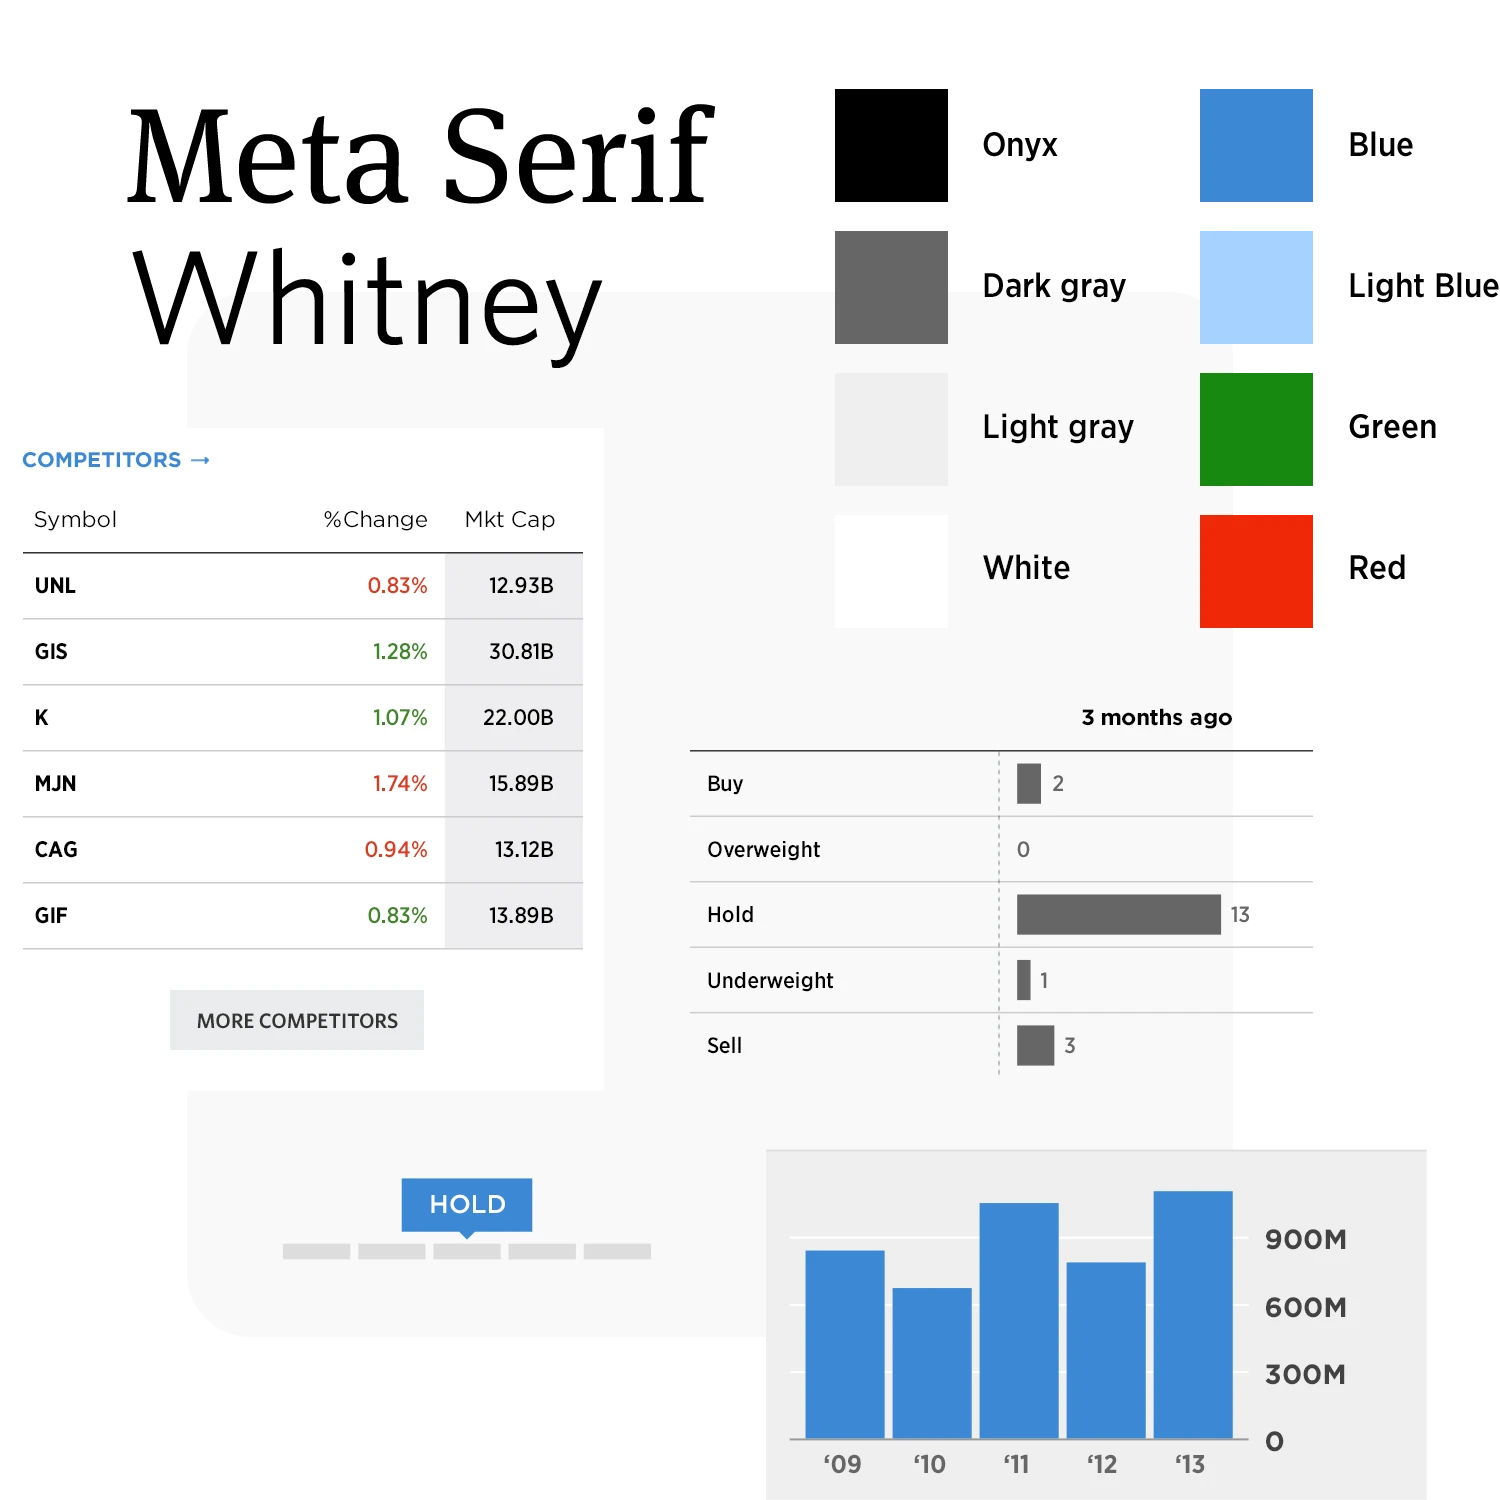
Users said that they relied heavily on related news, preferred viewing all content on a single page, and found tables more legible than charts (but trusted pages lacking charts less).
Based on our focus groups, I created three user personas to represent audiences worth targeting.
10%
Wanted a wide array of stock performance indicators, often for day trading
35%
Needed tools to help them assess potential clients, their needs, and their viability
55%
Didn’t actively manage their financial holdings but liked knowing their health
We tested the assumptions from our quantitative study with a larger quantitative study: a self-guided survey with a clickable prototype.
The results confirmed that most respondents fit our Business Professional and Personal Investor personas: they were seeking basic stock performance data, related articles, company health indicators, and company background information. Even Market Professionals rarely used the arcane charts that then constituted 80% of our content.
Our research showed users preferred data in simple charts and tables...not complex, interactive ones.
But this wasn’t just a UX rehash using an existing template: it was the first project in a full redesign of wsj.com. Every UI/UX decision might affect the rest of the site. My new styles had to be intricate enough to give order to a data-focused page like this…but not so intricate that they looked overwrought on a text-focused page.
So, I took a minimalist approach: I reduced the color palette, introduced a clean sans-serif font for data, and employed negative space and text refinements instead of the previous styleguide’s heavy boxes and drop shadows.
The final challenge was ensuring that the responsive design looked equally good on all viewports.
Our research gave The Journal solid evidence that they could cut costs without affecting traffic. Eliminating some of the rarely-used charts that constituted 80% of the market data section’s former content not only improved the UX but also allowed the company to cull expensive third-party data vendors, remove page-slowing JavaScript, kill tech debt, and stop time-consuming QA fixes.
Research saved the company time, too. The evidence behind the usability decisions and the glowing feedback from the prototyping exercises allowed the section’s product manager to quiet internal debate...and to relaunch this section almost two years before the rest of the site.
months
to plan and run 3 users studies
M
unique visitors per month
weeks
to create the UI/UX design